NGA GEOnet Names Server Ensures Uniform Place Names

If you work with international GIS data you know how important it is to have standards for place and region names. Many governments maintain stability in place names so they rarely change but there are always plenty of exceptions. Furthermore, spellings often have variations based on translations and dialect making it difficult to put an official name to a place, let alone have it be uniform across multiple applications.

Thankfully, there is the GEOnet Names Server (GNS) maintained by the National Geospatial-Intelligence Agency (NGA).  The GNS contains over 5 million geo-located features and more than 8 million feature names. Updated weekly, the GNS database provides its data through several means including an OGC web map service graphical interface, a text-based interface and a data download page.

NGA’s Name server viewer

So, whether you are designing and building an international geodatabase or you are just interested in place names, the GNS is the authoritative place to go. Bear in mind that the GEOnet Names Server is only for locations outside the United States. For official names within the United States see the US Board on Geographic Names.

The Map Was Alive with the Sound of Earthquakes

I recently saw a tweet highlighting a Youtube video showing 2011 earthquakes as a dynamic time lapse map. You can watch it on Youtube.

During the 9 minute video of a single map, the viewer is shown various sized rings at each epicenter location. The ring’s size is dependent on the magnitude of the quake.This in itself might not make for an exciting video. What captures your attention is the addition of sound corresponding to each earthquake presented. Each time one of the quake rings appear the map makes a short click. As the magnitude increases, so does the volume of the click. The video moves quickly covering days in just seconds and revealing the hundreds of earthquakes each month throughout the world.

It is profoundly disquieting and surprising when you see and hear the March quake near Japan that caused the tsunami and subsequent nuclear meltdown that is still affecting the people of Japan.

One could easily interpret the map with only its visual symbology but having sound represent an attribute of each quake represented by the ring symbol gives the destructive reality of high magnitude quakes more realism. It just made me wonder what the future might hold for sound symbol integration in GIS. Is there any point? Would there be any widespread application?

Maintaining Relevance as a GIS Professional

Technology changes rapidly. It seems like there is a new version of some device or software presented daily. GIS technology is no exception to this rapid change. While currently employed GIS professionals are usually in their position because their skill set matches the needs of the employer, keeping up with industry development can help you stay relevant. The best way to keep a position or move higher in a company is to be the expert in your field who is able to answer questions and solve problems that others cannot.
In today’s economy, no job is 100% secure. Businesses might downsize, shift focus or close altogether. This could leave a GIS analyst looking for another place to ply their trade. Or, perhaps you are a technician hoping to land a higher level GIS position. In either case would you be current enough with your GIS skills to land the new job?
How can you stay abreast of the constant changes in technology and know what changes you should be focused on to improve your skill set? It is easy to get overwhelmed by the number of software systems, tools, languages, platforms and technology uses there are out there. One way to keep up is to follow blogs (industry and individual) and relevant web sites. The idea here would be to learn about the latest and greatest innovations as they emerge. The problem with this approach is that not every new technology, tool or update will be utilized industry-wide (if at all). One would need to follow too many blogs and sites to get a broad view of the industry. Following blogs can still be a useful tactic, however, for keeping up with specific subjects.
I have found the best way to maintain currency across the GIS board is to study job postings. Even if you are not looking for a job, postings give you detailed insight into what GIS employers are interested in and what they are expecting out of their personnel. It really does not matter what software producers are developing. What matters is what businesses are using and how they are using it.
I make it a practice to search job boards on a regular basis. I am not looking for another position but for insight on how to be better in my current position. I find the best boards for doing this kind of research are the Geospatial Jobs Clearinghouse and Indeed.com. I start by searching for job titles that closely match my own. Then I simply read through the body of the listings and look for trends in the position requirements. The good news is that employers tend to structure their position details the same way every time. It usually looks something like this:
  • Company overview
  • Position Description
  • Requirements
  • Preferred experience
While the requirements section is probably the most important you should also pay close attention to the preferred experience section. These are the skillsets that can set you apart from the rest of the crowd. Most GIS professionals will have the typical requirements of a degree, experience using desktop GIS software and good communication skills. Those who have specialized skills like scripting/programming languages, photogrammetry, web design or database design will be in more demand. Specialized skills might not be mandated for a position but employers will see you as more valuable to their organization if you have them.
There are many ways to try and keep current with your profession. Whatever method you choose, remember that those who advance their knowledge and skills along with associated industry changes are the most likely to stay useful to their employer and outshine others in their field.

5 Nifty Mapping Sites From StumbleUpon This Week

StumbleUpon is a great site for finding web sites and blogs you might not otherwise come across. Of course many well known sites are there as well.

In my perusals I came across the following five mapping/GIS sites that I thought were interesting.

FlashEarth – Here is a nifty little satellite imagery viewing application. Flash Earth is refreshing because it does not look like Google Earth. Yes, it is flash based and it pulls its imagery data from Microsoft and Yahoo.

Picture of the FlashEarth.com home page

Wikimapia – Yep, it’s a Google Map powered wiki. Launched in 2006 there are over 15,000,000 places already marked. You can use the site for free and anyone can upload information without registering.

Picture of the WikiMapia.org site with North American extent

Maps Of War – Another flash based map site Maps of War is a collection of maps having to do with wars and war related subjects.

IRIS Seismic Monitor – The Incorporated Research Institutions for Seismology is a consortium of universities that aquire, manage and distribute seismological data. The Seismic Monitor is the geospatial mapping application they use for the distribution. The application is not perfect. You can only zoom to a small scale view of an area but the information is interesting. Play around with it and see what you think.

Picture of the Seismic Monitor map
Worldology.com – Interactive geopolitical maps focused largely on Europe. While the site does not yet cover a large portion of the earth, the site’s creator intends to expand his project worldwide.
Picture of the worldology.com site


Please Don’t Be “The Map Guy”

It never ceases to amaze me how many GIS professionals feel the need to brand themselves “The Map Guy”. If you could collect a business card from everyone at a GIS conference you would find maybe a quarter of them with “The Map Guy!” printed below their name. It’s not a bad tag line for someone who makes maps but for goodness sake, it’s been done.

Of course it does no good to complain about something unless you can come up with an alternative. Here are a few business card ready tags you can use to show yourself to be a unique member of the GIS community:

  • The Ace of Maps
  • The Map Ninja
  • The CartoWarrior
  • The GeoGiant
  • Not To Scale
  • The Carto Kid
  • The Human Projection
  • Thematic and Proud
  • The Mad Mapper
  • CartoManiac
  • And my favorite – The Original Geographer

There, see? Now there are no more excuses for following the crowd. Now go out and be someone different, and no, “The Map Man” Doesn’t count.

6 Ways to Squeeze More GIS Juice From Your Budget

We all love working for an organization with deep GIS pockets. When there is a fat budget you can afford to buy more toys, upgrade the toys you already have and generally keep up with technology.

Our current economy, however, has impacted even the biggest budgets like that of the Federal government and most state and local ones too. Private companies have not been immune either.

Dollar Bill


There are ways to grow your geospatial program though. You just have to become a little more creative in how you approach your acquisitions. Following are six ways an underfunded GIS team can thrive in a down economy.
  1. Ask your software vendor for an upgrade. Most software companies work to constantly improve their products. When they compile enough changes they will release a new version. Find out if your current maintenance schedule already includes new versions. Even if your maintenance agreement has expired or you never had one, you might be entitled to an upgrade to the next version after the one you bought.
  2. Learn scripting to automate your processes. They say time is money. If this is true then learning a relevant scripting language can be worth its weight in gold. One useful and popular language in the GIS world is Python. Python can be used not only for scripting but for full blown product development. It is easy to learn and there are plenty of resources out there to help you utilize it. ArcGIS 10 is probably the most widely used GIS platform supporting Python but the free and open source Quantum GIS does as well.
  3. Speaking of free and open source…. If your organization is open to open source software and free products on their network, you should definitely look into it. If you can only afford to maintain a few paid seats of ArcGIS you could augment your holdings with the previously mentioned free and open source Quantum GIS (QGIS). QGIS can read and write Shapefiles and PostGIS data, both of which can be utilized in ArcGIS. Products such as Google Earth, MapQuest, and Open Street Map can also be powerful geospatial tools and can either augment your current software or in some cases replace it. Some of these software products even provide development APIs to create your own custom tools. It all depends on what your mission is.
  4. Ask your local college for help. Do you need to be freed up to pursue important projects that have been languishing? Utilize your local GIS students for digitizing, GPS location and more. Talk to the head of your local college GIS program about hiring students as interns. You can typically pay them a lot less than a regular hire but still get great results. They get the benefit of experience; you get the benefit of accomplishing more in budget.
  5. Mine the internet for free data. There is always the fear that data from the internet is inaccurate or outdated. That is certainly true in some cases but there is plenty of quality low cost or free data to be had. A few examples of quality (usually) data providers include federal, state, county and city governments, special districts such as utilities and university data repositories. Check to see if the data has associated metadata available. This will tell you if you are working with quality or if you should be looking elsewhere for your needs.
  6. Buy used equipment. If you are in need of new data collection equipment (GPS receivers or survey equipment), data manipulation equipment (computers), or data output equipment (plotters and printers) eBaycould be your answer. The online auction site is still going strong and offers just about anything imaginable. Try creating a custom search for the items you are looking for and keeping watch for great deals. You can determine the price you are able to spend and then start bidding. This might take a little longer than traditional purchasing methods but the cost savings can be worth it.
Even if your GIS team is on a shoestring budget there are many ways to maximize output and proficiency while staying on top of current GIS trends. As shown above, open source and free products are widespread and in many cases perform just as well if not better than their proprietary and fee based brethren. There are also plenty of ways to find help and equipment at prices lower than you might normally pay. Do you have suggestions of other ways to save money while growing your GIS presence? Leave a comment and let me know.

Gardengraphic Information Systems – How Maps and Data Help Gardens Succeed

Spring will soon be upon us and gardeners of all stripes will begin pruning landscapes and planting vegetables. The National Gardening Association reports that gardeners spent nearly $3 billion in 2011 on food gardening alone. With this much money being spent (not to mention the amount of time) to grow produce or create beautiful landscapes, it stands to reason that most gardeners would appreciate any advantage they could get to make their efforts fruitful.
Trowel
Modern mapping and GIS is just such an advantage. With a computer and an internet connection, today’s gardener has at his fingertips a wealth of information to help make decisions about things like plant selection, date of last frost and possible blight. The following are just a few of the sites a tech savvy gardener might consider consulting before sliding his spade through the topsoil. Taken together they form what I like to call my Gardengraphic Information System.
  • The USDA Hardiness Zone Map is probably the best known of the maps listed here. It is used by gardeners and farmers nation-wide as a general guide for selecting plants that will thrive in a given location. The map is divided into zones that depict average annual minimum winter temperatures. When you go to purchase plants or seed packets you will often see what zone the plant is recommended for. The 2012 hardiness zone map is available for download but is now also available as an interactive map that can be searched by zip code.
  • While knowing the hardiness zone that you live in is important, it can be equally important to determine when frost might begin appearing in the garden in the Fall. The Better Homes and Gardens First Autumn Frost Map might help do just that. While the map is not very precise, it can give a general window for the gardener to keep watch on the temperature.
  • Another USDA map useful to the gardener is the soil survey map. The map provides soil data and information for more than 95% of the counties in the United States. The soil in an individual’s home garden will likely be slightly different than what is found in the map but the survey will describe the major soil types for a given area. This can be extremely helpful to the gardener who is trying to decide how to best amend his soil for the type of planting he intends to do.
USDA Soil Survey
USDA Soil Survey
  • USAblight is “a national project on Late Blight of tomatoes and potato in the United States”.  Tomatoes are one of the most popular vegetables grown in US gardens. It is easy to see why this disease is an important one to track. Late blight was the cause of the Irish potato famine in 1845. USAblight uses a Google map to show reported incidences of Late Blight. The map can be checked to track outbreaks or to report one.
  • Just to emphasize the importance of Late Blight, uspest.org has designed their own Google powered blight risk map. This one displays not only reported outbreaks but risk conditions throughout the US. Other maps available for use on this site include Daily degree-day accumulation modeling maps and a  Page with Weather, Plant Disease Risk and Degree-Day/Phenology models.
  • Again the USDA provides a useful application that the gardener can leverage for his own use. The PLANTS database provides information about a variety of plants found throughout the United States. The most significant category for the knowledgeable gardener might be on the topic of cover crops. Clicking on this link will bring up a list of cover crops. The user can click on the plant’s name and be taken to an interactive map showing US states and counties. Clicking on your state will show whether that cover crop is native or naturalized. Much more data than this is also presented about your selected plant in a non-spatial format. This database also has fact sheets, guides, culturally significant and alternative crops data and information about invasive and noxious weeds.

Gardening is one of the most popular hobbies in the United States. It is also one that can directly benefit from GIS technology. If you have a green thumb I highly recommend spending a few minutes checking out some of the above resources. If you know of any other sites that would help gardeners be more efficient or more productive, leave a comment below and let me know what they are.

Update 2/25/2012:

The good folks at Hampton Hollow Farm ( @HHollowFarm ) pointed out that they use AgSquared, an online farm planning and management software package, to run their organic vegetable farm in Nova Scotia. According to the AgSquared website the software allows you to create a “Farm Plan” which includes an interactive field layout mapping tool. You can also manage your farm’s schedule, keep year to year records, plan harvests and generate reports. The software looks powerful and was designed for small farms but even the home gardener could benefit from its use. The software’s regular price is only $60 per year making it affordable even for hobbyists.

Are Paper Maps Dying?


With all of the visualization technology we have available, why do we still find it
necessary to print maps? With desktops, laptops, smartphones and tablets, it would seem that paper map production should be all but extinct. This does not seem to be the case though.

 
Technology has broadened our access to maps we previously could not obtain and created new mapping products that we might not have even considered before the popularization of personal GIS.
 

Likewise, when Kindles and later Nooks first started appearing it was said they would herald the demise of the printed and bound book. 

We have certainly seen plenty of bookstores go out of business over the last few years but the last time I was in Barnes and Noble there were plenty of books still to be found.

 
Amazon Kindle


So why do we continue to print what we can simply view instantly and continuously? Here are a few reasons why paper maps are not going away any time soon:

 
  • Paper maps do not freeze up or run out of batteries. A GeoPDF on your tablet is a great tool. It becomes somewhat less effective when your tablet is not working properly.
  • Cost of new devices can be an issue. This is becoming less a factor as technology becomes cheaper and plotters, ink and paper prices stay the same or rise. Technology is still a new investment for many organizations, though.
  • Paper maps give the big picture. There is only so much of a map that one can fit on a computer screen without having to reduce its on-screen size. It is easier for the brain to process a map of fixed size than to readjust its spatial understanding with a zoom.
  • Physical maps are easy to share. A paper map can be passed between several people without worrying about computer access, having the right program installed, formatting and compatibility.
  • Humans still desire tangible and tactile things. A paper map has an aesthetic that appeals to the human need for real things.
Let me know what you think about the future of map media.


Free GIS Data – Ten Favorite Sources

GIS data is everywhere. Some you have to pay for but much of it is free and widely available like at the sites below. Doing a search for free GIS data will yield some of the data sources I mention here. Locating other sources just takes a little digging. Almost all of these sites are from the U.S. government so the datasets are largely nationwide.
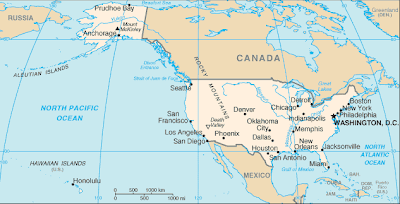
Map of United States
  1. GIS Data Depot – Large data holding in various formats from various sources.
  2. USDA Geospatial Data Gateway – Environmental and natural resources Data including imagery
  3. BLM Internet Sites – List of BLM sites hosting a variety of public lands data. Some state specific data
  4. U.S. Department of Transportation – Transportation data sets and links to other GIS data sources
  5. National Park Service – Interactive data search map. Data provided in .csv or .xlsx formats
  6. EPA – Environmental Dataset Gateway
  7. USGS – High res orthoimagery downloads from the Seamless Data Warehouse
  8. FEMA – Emergency and disaster datasets in formats including KMZ, shp, and geoRSS
  9. Census – TIGER products including data up to 2011
  10. NOAA Vents Program – Great resource for Bathymetric GIS datasets related to hydrothermal vents
Other great sources for free GIS data include city, county and state websites. Pages likely to include useful geospatial data include departments of transportation, departments of wildlife and county assessor’s offices.
Many government entities centralize their GIS data repositories. Others will distribute the data to the various departments they pertain to. With a little bit of site searching you should come up with whatever you are looking for.

Using Pinterest to Catalog Online Maps

Pinterest

What is Pinterest?Cartographers and GIS users are often visual by nature. Pinterest is a tool that allows the visually minded to capitalize on images posted throughout the web. In a nutshell, Pinterest allows a user to “pin” images, found on the web, to virtual pin boards. These pin boards are organized by topic and the images you save to them link back to the original page they were found on.

Pinterest geospatial pin boards
Here are a couple of my pin boards I use for geospatial images and maps


Pinterest is sometimes thought of as a social network for women interested in home décor or fashion or recipes. To be honest, I first head about the site from my wife who has a food blog. When I saw what you can do with the site, however, I knew I had found a great resource for organizing, saving, and enjoying maps found online. Of course I don’t use it only for maps. I use it to inventory anything of visual interest that I come across including food, clothing and various hobby interests. That, incidentally, is how the site got its name. Users pin their interests.
The social aspect of Pinterest comes with its follow and re-pin functions. This allows you to view images saved by others with similar interests. I have searched Pinterest and while there are a few maps here and there, the geospatial and cartographic communities have yet to really discover the site.
How to Use Pinterest
As of this blog post Pinterest is available as an invite only network. If you know someone who has an account you can get them to send you an email invite. Otherwise, you can use the Request an Invite button on the log in page.

Pinterest request invite button
You can request an invite at Pinterest.com


After receiving an invite and signing up for the site you will be prompted to install a “Pin It” button extension for your browser. When you are visiting a page with images on it, you can click the Pin It button which gives you the option of pinning some or all of the images found. You can add the images to any board in your Pinterest profile or create a new custom board right then. In addition to the image you are asked to provide a description of the pin.
Users are given several default boards when they sign up. These can be deleted or renamed and new boards can be created. This benefits the cartography connoisseur by providing a framework in which to categorize and link to maps found while perusing the web.
Conclusion
The goal of most social networking communities is to interact and converse on topics of interest. Pinterest is no different and is perfect for those of us with geospatial interests. I have only just begun to utilize the site and hope to see my virtual pin boards grow throughout the year. Let me know what you think of Pinterest as a tool for geospatial users. If you decide to join you can
Follow Me on Pinterest Button
Update:

The more I use Pinterest and engage with the community, the more geospatially oriented folks I find including  Big Map Blog who recently started following my pins.