Where to Find the desktop.msi File for Performing a Silent Install of ArcGIS for Windows

If you want to perform a silent install of ArcGIS desktop for Windows using the Microsoft Installer (.msi) file, you need the actual .msi file. But finding the .msi file can seem difficult. It’s nowhere to be found on the ESRI download site (that I could find).

It turns out to be quite easy to get the installer. First, download the ArcGIS desktop installation executable from the my.esri.com site. This will be named something like ArcGIS_desktop_108_172737.exe.  Using Winzip, 7-zip, or another compression utility, extract the files just like you would with a .zip file.  In the extracted directory, click into Desktop, then into SetupFiles. The desktop.msi file will be sitting right there.

Which ESRI Javascript API Version to Use – 3.x vs 4.x

Which ESRI Javascript API version should you use for your next mapping app? I wish it were as simple as just using the most up to date version. And maybe it will be for your situation. But there are a few considerations to address before pushing ahead.

Start With Your Goal

Always start with your goal. What do you want the app to look like and do? Probably, the biggest question you should ask yourself is whether you will be creating a 3D app or a standard 2D app?

As of this post, the 4.x API is at version 4.11. According to ESRI’s API Capability page, version 3.28 (the latest 3.x version) doesn’t support 3D rendering. Version 4.11 only has partial support for 2D. So, if you’re planning to create an app that supports 3D visualization in any way, you’ll need to use 4.11.

On the other hand, if you are only supporting 2D visualization you’ll want to use the latest API that supports all of the other functionality you might want to use. This is really important to consider if you’re thinking about migrating existing 3.x code to the 4.x world. You would hate to get deep into the conversion only to find out a critical component you rely on is not yet supported.

Check out ESRI’s functionality matrix to determine if 4.11 is implementing all the functionality you need right now. ESRI’s stated goal is to eventually have 4.11 eventually exceed the functionality of the 3.28 API. But until it does, you’ll want to proceed with at least a little bit of caution.

Consider Your Time

Another thing you will want to think about is the time you will spend getting up to speed on the syntax changes that version 4.11 brings. Right away, when creating a basic map with 4.11, you’ll notice that you now have to not only create a map but a map view (or map scene if it’s a 3D app) in order to get anything to render.

With the old 3.x API you would simply declare the map object and pass in a reference to the HTML element you want to use to render it in. As of 4.11, the Map object is now simply a container for the various layers you want to associate with the app you’re creating. There is now a new class called View that manages UI methods for your app like rendering the map within the HTML element and placing components (like widgets and images) on screen.

I like most of the new syntax changes that I’ve seen in 4.11 but I realize these slow down my development time as I get used to them.

How To Export A Feature Class Attribute Table From ArcGIS Pro

Several years ago I wrote about how to export an ArcGIS feature’s attribute table as a CSV file. ESRI didn’t make this extremely intuitive. Since that time I’ve moved into using ArcGIS Pro and thought I’d post about doing the same thing in this application.

It’s even easier to export table records in ArcGIS Pro. You can select a subset of records in your attribute table if you aren’t trying to export the entire thing. Then, right-click on the feature and click Data -> Export Table. Alternatively, click the feature layer “Data” tab and select Export Table. A geoprocessing dialog table will open with a Copy Rows task. 

Under the Output Table parameter enter a name for your table with a .csv extention. You can also choose to save your table as a .dbf, in a geodatabase or as a .txt file(comma delimited).

Incidently, if you try to save your table outside of a database but without an extention, the tool will default to exporting as a .dbf file.

This process isn’t difficult but it might throw some people off since you can’t select your extension in any dialog dropdown. You have to type it out yourself.

Toggle Layer Visibility Using URL Parameters in Web App Builder Developer Edition

ESRI’s developer edition of their Web App Builder (WAB) is a handy stand-alone tool for creating web mapping apps. While the WAB is a tool for building an app without needing to code anything, the developer edition allows users to create their own widgets and extend current functionality or themes. Even with this capability, however, there are some situations where the pre-formed development framework just doesn’t go far enough.

This was the situation I found myself in recently when trying to use the WAB to replace our custom built web map viewer at work. Our current viewer interfaces with a few third-party apps by accepting URL parameters that turn on or off layers and query various layers. The WAB does allow for querying layers using URL parameters but it doesn’t have the ability to toggle layers using the URL method.

I searched around the internet trying to find someone who has solved this problem but never found a useable solution. ESRI provides URL parameter layer visibility functionality on their ArcGIS Online platform but this hasn’t made it to the WAB Developer Edition yet. I’m not sure when or if it will.

Since layer toggling is a must-have functionality for us I decided to work up a solution myself. Thankfully, the developers at ESRI named the WAB’s URL handling module mapUrlParamsHandler.js so it was pretty easy to figure out what needed to be modified.

Parameter Modeling

To fix my problem I just had to add one new function. The actual turning on and off of the layers in this function was taken care of by the WAB API. The biggest concern for me was deciding on how the parameters should be passed in the URL so they would be easy to use on the client side and easy (and fast) to process on the server.

I considered using the Esri ArcGIS Online model of ?layers=show:0,1,2,3 for passing in layer visibility parameters. However, this becomes very cumbersome when considering showing and hiding both layers and sublayers. It would look something like ?layers=show:0,1.0-2-5,3,4;hide:6,7 or some other cryptic looking mash of numbers and characters. I wasn’t even sure the online API accepted a hidden parameter. They don’t show one in their documentation.

I then considered using two separate parameters for showing and hiding (?showLayers=1,2,3&hideLayers=1,2,3) but this just adds more complexity to the code on the back side as well as the parameters the client has to plug in. Ultimately I settled on using a single parameter called layers. But then I needed to decide how to reference those layers.

If I used a zero-based index URL parameter list, then if the layers in the web map ever change position, I’ll have to go in and change the URL references to those layers. On the other hand, if I used the titles of the layers, it wouldn’t matter what the index position of the layer is. The name of the layer and the title would still be the same.

It’s true that the title of the layer could change too. In that case, we’d still have to update the URLs we’re passing into the app. But in our situation, this is less likely to happen than the position changing. Using titles has another advantage of making it clear to the casual observer exactly what layers are being acted upon. This wouldn’t matter that much since the public isn’t going to be encouraged to pass parameters into the URL. But it might be nice for us developers to know what we’re doing.

I ended up using layer titles since they’re human readable and don’t rely on positioning within the web map that drives the web app. However, I created both versions of my modifications so that someone else who wants to use layer indices can do so just as easily.

In my parameter, layers are separated by commas with layers to be shown represented by the layer title (or positive index integers) and layers to be hidden represented by layer titles with a minus(-) symbol in front of them (or negative index integers).

Toggling Sub Layers

I also wanted to be able to toggle sub-layers on and off. Sublayers to be toggled will be shown by separating the parent layer from the sublayers with a colon. The sublayers themselves will be separated by semicolons.

In WAB apps, sublayers are 0 indexed underneath their parent. Suppose you have an active layer called School Boundaries with a map index position of 6 and it has three sublayers for High Schools, Middle Schools, and Elementary Schools. These sub-layers would be indexed as 0, 1, 2.

I decided to stick with index references for the sublayers since it was easy to do so and makes sense. It’s also easier to read in and understand within the URL since the parent layer is text so there’s some contrast. 

With the above model of building your URL for layer toggling, you can take care of almost any layer manipulation scenario you can think of.

This would turn on the Schools layer as well as the first, second and third sublayers: 
?layers=Schools:0;1;2

This would turn off the Schools layer and deselect sublayer 0, then turn the schools back on and select sub layers five and six:
?layers=-Schools:0,Schools:5;6

Edit: Having to turn an entire layer off and then on again, just to get at the sublayer, was cumbersome. Now you can use the minus symbol in front of the layer title or the sublayer index to turn them on and off independently. For example – ?layers=Schools:-0;5;6


Multiple Params


Another problem I have with the URL parameter handling capabilities of the Web App Builder is that you can’t add multiple parameters. In other words, you can’t pass in layers to turn on and do a query on a layer at the same time. To solve that problem I just modified the main function in the module to check all URL parameters rather than stopping after finding the first one.

mo.postProcessUrlParams = function(urlParams, map){
    //urlParams have been decoded.
    for(var key in urlParams){
      //Loop through the urlParams object
        if(urlParams.hasOwnProperty(key)){
          //For each parameter found, run its function
          if('layers' === key){
            toggleLayers(urlParams, map);
          }else if('extent' === key){
            setExtent(urlParams, map);
          }else if('center' === key){
            setCenter(urlParams, map);
          }else if('marker' === key){
            createMarker(urlParams, map);
          }else if('find' === key){
            sendMessageToSearch(urlParams);
          }else if('query' === key){
            queryFeature(urlParams, map);
          }
        }
    }
  };

How to Use

In order to use the modified mapUrlParamsHandler module in your WAB project, you first need to download the appropriate one (index driven or title driven) from Github at https://github.com/RyanDavison/WAB_URL_Parameters. Then replace the native file located in \WebAppBuilderForArcGIS\server\apps\<Your Apps ID Number>\jimu.js .

If you’ve already exported your app and are hosting it on your own server just find the jimu.js folder and paste the file in there. Alternatively, you could just copy the code out of the files on Github and paste it right into the native mapUlrParamsHandler.js file. That’s all you have to do to get layer toggling functionality through your URL.

In the future, ESRI might enable this same functionality in the WAB Developer Edition. If they do, it’s a good bet they won’t have the same URL structure as me. As I’m writing this, The Web App Builder is at version 2.9. So if you start using my modified code now, you might be changing your own URL structures to match the ESRI API in the future.

If you have any questions, comments or problems feel free to leave them in the comments section below or contact me on Github.

EDIT:
When I first wrote the modification You could only turn sub-layers on and off along with their parent layer. So, if you wanted to turn off sub layer 2  but turn on sub layer 3 of LayerX you would have to write

?layers=-LayerX:2,LayerX:3

It was a two-step process that was very clunky. Now, you can turn off sublayers independently. So the query above would now simply read:

?layers=LayerX:-2;3

Of course you can still turn off an entire layer like this:

?layers=-LayerX

Custom Color Ramps For ArcGIS

Back in 2012, I wrote a post about loading custom color ramps into ArcGIS. It’s been a consistently popular post but is very outdated. In that post, I suggested downloading and installing ESRI’s ColorRamps2.o package. ColorRamps2.0 was replaced with ColorRamps3.0 around the time I wrote the post. Today, although there’s a link to download ColorRamps3.0 it doesn’t seem to be functioning.

Instead of simply updating an old blog post, I thought it would be helpful to write a new updated post. I’ll show you how to create color ramps on the fly in ArcGIS and how to import custom color ramps into ArcGIS 10.5. I’ll also provide a list of color ramp creation and download sources.

If you already have a color ramp .style file, you can follow the steps below to add them into ArcMap:

  1. Copy the .style files to C:\Program Files (x86)\ArcGIS\Desktop10.5\Styles. Your Styles will be different depending on your operating system and version of ArcGIS.
  2. Open ArcMap.
  3. Click the customize dropdown and select Style Manager.
  4. On the right side of the Style Manager click on the Styles… button. At this point, your custom style name should just show up in your style manager. However, if it doesn’t because you put your style file in a different directory or some other reason, you need to follow two more steps. First, click Add Style to List. Navigate to the directory where you placed the .style files and select your custom file. Highlight the file and click Open. You will have to do this for each .style file you want to add.
  5. After all of the styles are shown in the Style References list, make sure they are check marked and click the Set as Default List button.
  6. Click OK and you should see your styles on the left side of the Style Manager. Close the style manager. Now, you can go to the symbology tab of your Layer Properties for a given raster and select one of the new color ramps. If you want to see the text descriptions of the ramps, click on the color ramp dropdown and uncheck ‘Graphic View’.

So where can you find alternative .style files with color ramps? It seems to be getting harder to find them these days. As I mentioned above, you used to be able to get them from the ESRI mapping center but that resource seems to be abandoned. Let me know if you know where to find ColorRamps3.0 or 2.0 today.

ColorBrewer2.org used to be another good resource but the site has removed the option to download ramps in the .style format. Fortunately, you can still access them by going to http://www.reachresourcecentre.info/arcgis-colorbrewer-color-ramp-style and downloading the zip file.

You can check out Fred Lott’s color ramps on GitHub too. Of course, if you aren’t finding quite the ramp for your needs and you’re trying to show quantities, you could always build your own.

To set your own quantities ramp for your layer, follow these steps:

  1. Right click on your layer and go to the Symbology tab.
  2. Click on Show Quantities and select Graduated Colors.
  3. Choose your field’s value and normalization and how many classes you want your data broken into. Your classes will already have a color ramp assigned
  4. Double click on the first class symbol color. Choose another color that you want for the start of your custom ramp.
  5. Next, double click on the last class symbol color and choose the last color in your ramp.
  6. Right click on any of the symbols and select Ramp Colors. This will generate the color ramp between the top and bottom colors you chose.

So there you have it. If you’re not happy with what ESRI has already provided you for styles you have a few options for customization. If you know of any other style resources I didn’t mention, please feel free to let me know in the comments. Thanks for reading.


Old Mapping Site Reviews

Back in 2012 I put together a list of five mapping/GIS sites and apps that I thought were interesting. I typed them up, posted them and then forgot about them. Now, six years later I found them and checked to see what their status is. Amazingly, most of the sites are still up and running in one form or another.

I guess I feel a little validated that the sites I thought were of high enough quality to share back then turned out to be high enough quality to last as long as they have. It’s not uncommon for projects like these to start off with promise only to soon be relegated to the internet archive. You can check out the original post 5 Nifty Maps from StumbleUpon and see the screenshots as they were when I took them in 2012. Otherwise, here is the list, updated six years later.

The Maps

ZoomEarth – Here is a nifty little satellite imagery viewing application. When I first found this site, Zoom Earth was called Flash Earth. Its claim to fame was that it was a Flash based alternative to Google Earth. Of course Flash has gone the way of the Dodo across most parts of the internet so at some point the app was changed to Zoom Earth. It now claims to have new satellite imagery every day. It’s cool to zoom into an area and scroll through different dates of imagery for the place. However, if you get in close enough to actually see anything useful, the option to change the date goes away. 

Wikimapia – Wikimapia is a weird entity somewhere between Google Maps and OpenStreetMap. You can upload your own information about geographic places and objects. It’s been around since 2006 but it still has a 2012 copyright. I’m thinking the site doesn’t get much love except a yearly domain renewal.


Maps Of War – This site doesn’t seem to have change much since I first looked at it. Half of the maps deal with the Middle East and the Iraq War. The maps are still flash based so it looks like nothing is really updated. But, at least it still exists. 

IRIS Seismic Monitor – The Seismic Monitor is the graphic interface for seismological data from The Incorporated Research Institutions for Seismology consortium. It’s an interesting app if you’re into earthquakes. Even if you aren’t excited by shaking dirt, the colored map markers are pretty.

Worldology.com – Not too long ago, this site was up. Now it’s not. If you still want to check out some of the old flash based maps from the site you can see them over on the Internet Archive. Hey, four out of five still isn’t bad.


A Little Background on Map Elements

The problem

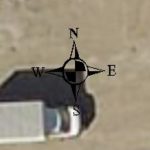
If you’ve ever had to place map elements like north arrows, text or scalebars on an ArcGIS made map, you know how they can get lost in the background of imagery or some other basemap. You can always try to change the items color or size to make it stand out. But the easier and more effective method is to change its background color to a solid color like white.

Compass Rose
Map elements can get lost in the noise.

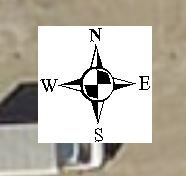
The problem with doing that is the background extent only stretches to the edges of its element. There is no padding between the element edge and the background edge.  Thankfully, ArcMap provides us with the ability to set a gap between the two edges.

Compass rose with white background.
Default backgrounds on map elements have no padding.

How to fix it

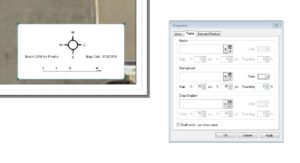
In ArcMap, right-click or double-click on the element to open its properties. Open the Borders and Background tab and select your backround color from the dropdown. Next, change the X and Y values next to “Gap”. The higher the number, the more padding you’ll get between element and background edge. You can also apply a “Rounding” percentage value to give your background panel rounded corners. That’s all it takes to make your ArcGIS map easier to read and more professional looking.

Map elements.
Adjusting background gap gives elements room to breathe.

Mapping The Dead

Skull and Crossbones

I’ve seen a lot of interesting mapping applications in the news over the last year. One that’s caught my attention is cemetery mapping. I had never really thought about just how ideal a cemetery is to be mapped. Each plot has a distinct spatial location. They have measurable attributes like occupant, location, depth and width. They are often laid out like a grid or a table but sometimes (especially on older properties) they are spread out seemingly without much thought to being easily located again.

Locating a plot is obviously the most important attribute for cemetery mapping. Caretakers have to be able to determine where a body is located so they can avoid accidentally digging it up when placing another body. Relatives of the deceased want to know where their family members are too so they and those in the future can find them again.

One of the first articles I cam across last year was about the cemeteries in the City of Mackinac Island Michigan. The city’s cemetery committee (I bet those meetings are fun) recognized that its current data holdings (hand-drawn paper maps, incomplete lists of cemetery residents and the memories of senior committee members who are increasingly ending up in the cemetery themselves) were not adequate. So they started mapping out plots using GPS and building a database of names.

The City of Mackinac Island Cemetery Committee hopes to have a completed digital mapping system by next June, which will help the city clerk’s office keep track of plots and burials more efficiently. The map is one of many updates the city is considering relating to its cemeteries and burial policies.

It didn’t surprise me to find that some cities are using GIS technology to keep track of cemeteries. What did surprise me was the number of software packages that have been created for mapping and managing them. A quick search for cemetery mapping software reveals several pages of apps, services and companies with interesting names like Memorial Business systems, CemMapper and The Crypt Keeper.

Yet with all of these software solutions, none of the cemeteries that I was interested in searching had detailed mapping of their plots. Only one even had a website. Although the mapping technology is there, this kind of project doesn’t seem like one many cemeteries are willing to undertake.

Shapefile as a Multi User Editing Environment?

I had a ArcGIS user that I support come to me with a corrupted shapefile the other day. It had the old “number of shapes does not match number of table records” error. It turns out, he’s still using this shapefile as his layer’s main data source and he and several others regularly edit it! In this day and age?

I tried to convince him using a file geodatabase would be more stable for editing but he had been using shapefiles so long I don’t even think my comments registered. He just wanted a tool that could fix the shapefile.

I pointed him to the shapechk tool by Andrew Williamson. I’ve used the tool for years because <sarcasm>for some odd reason</sarcasm> I often run into people with corrupted shapefiles after people edit them over long periods of time. The shapefile works OK as a data exchange format but doesn’t always hold together under regular heavy use.

In the words of Pete Seeger, “when will we ever learn?”